
What's included
- Repeated alerts: no duplicate, one note per hour at most
- A new alert within 24 h reopens the ticket
- Send a test alert right from Xendor
- Overview of open alerts and source health
Checkmk, PRTG, Zabbix, Datadog or an RMM: Xendor receives alerts via webhook and turns them into tickets or notifications – without duplicates.
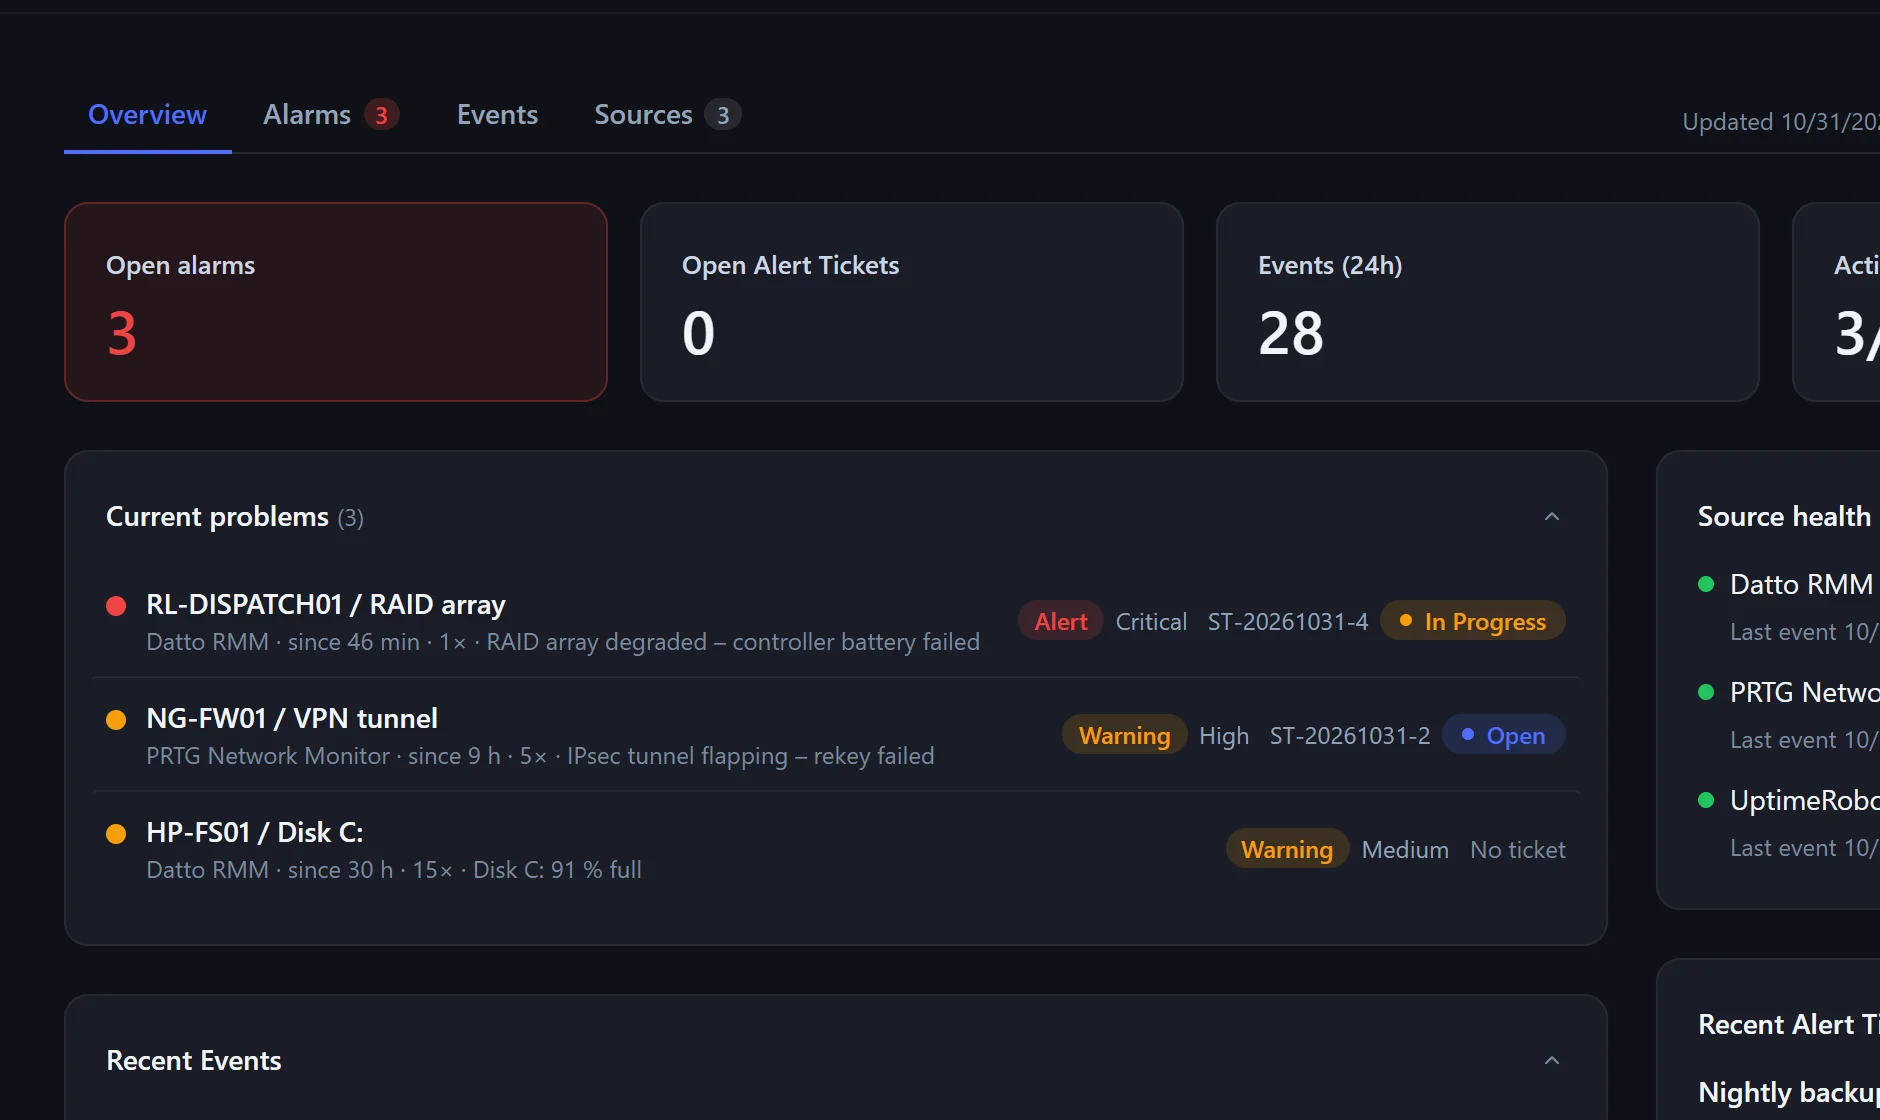
Copy the webhook URL into your monitoring tool. Fields are detected automatically.
Which state, severity, host or service creates a ticket, who is notified and with which priority.
The host is matched against your assets; the ticket gets the device and the customer. On "OK" it can resolve itself.
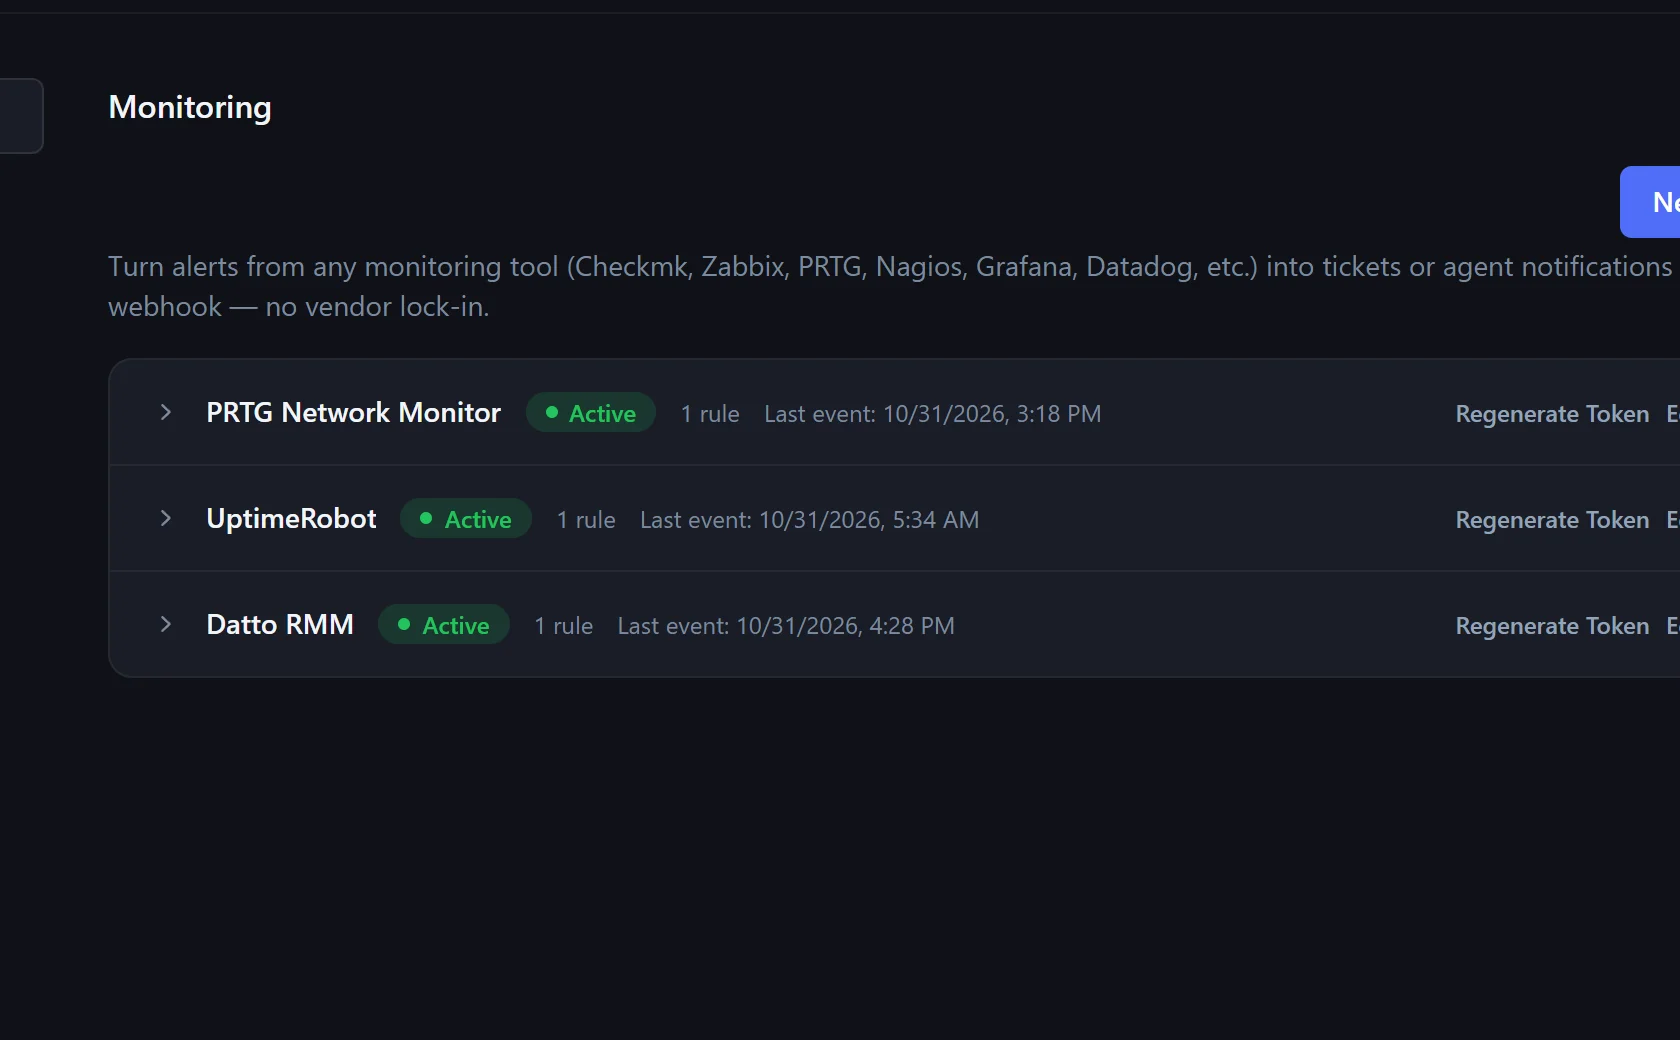
Any tool that can send a webhook – e.g. Checkmk, Zabbix, PRTG, Nagios, Grafana, Datadog.
No. Rules can also just notify or only log.
The overview shows "No event for over 24 h" for that source.
In the pilot program: personal onboarding, then $25 (US) or €25 (EU, plus VAT) per agent per month, guaranteed for 24 months.